

#24 Compounding value: Part I
#24 Compounding value: Part I
The holy grail of long-term investing: ROIC and growth

Intrinsic value creation is a matter of the greatest importance. Investor’s performance over the years is going to be closely related to the capital efficiency of the companies we are invested in. However, and for some inexplicable reason, I hardly find people speaking about it. Attention is centered normally on operating margins and growth.
However, analyzing correctly the intrinsic value creation of companies is not always a trivial task. It requires time and understanding. During the next 3 articles, as it is already a tradition, we will focus on establishing a conceptual framework at first, to later go into the mud and analyze the value creation parameters of different companies and industries. This first piece will discuss ROIC and growth. Next week, it will be centered in reinvestment rates and incremental returns on capital, to finish applying all these concepts to particular companies.
Welcome to Edelweiss Capital Research! If you are new here, join us to receive investment analyses, economic pills, and investing frameworks by subscribing below:

Drivers for value creation
An investor can get value by becoming a shareholder of a company due to 3 principal reasons:
1. The shares were undervalued when we bought them and somehow, the market changed its narrative and the shares passed to be correctly valued.
2. The “so-called” multiple expansion: It happens when a company increases its quality with better returns or because its competitive situation has improved. Normally it is thanks to good management and correct capital allocation. Another reason for a multiple expansion can be found in the expansive monetary policies of the central banks (nothing we can do about it, so we can forget about this one).
3. Intrinsic value creation: revenue growth at higher levels of returns on capital than the cost of this capital. It is maximized when the management reinvests the capital at high rates with adequate returns on this incremental capital invested.
In this 3 part series, we are going to discuss this last point. We will see how to identify why a company has been able to create outstanding value and guess if this wealth creation has the potential to continue in time.
Today we will take a look at the return on capital and different types of growth. We will see some common pitfalls and how to calculate them properly. In the next post, we will review two complementary concepts which sound pretty similar, but give us another understanding of the company's evolution: the return on incremental invested capital and the reinvestment rate. Finally, in a third post, we will apply these concepts to different companies to see some tangible impact and understand better the dynamics of intrinsic value creation.
Return on Invested Capital (ROIC)
ROIC is a measure of capital efficiency. When you become a shareholder in a company, you become a partial owner of the company’s assets. Therefore, your capital is being used to generate services and products, and hopefully, some profits.
If the company requires 100 of capital invested to make 30 of profit, the return on capital invested will be 30/100=30%. Easy, right? The only problem with ROIC comes when one has to define capital invested. Companies account concepts differently and not all balance sheets are the same. Therefore, invested capital can not be calculated automatically, with the risk of doing it wrong. This “difficulty” makes many people focus on other simpler metrics. However, ROIC is the key parameter to determine how good is the company using our capital.
A common mistake: low margins ≠ bad business
As we were saying, many investors focus on easy and straightaway metrics to take investment decisions. One of them could be operating or profit margins. We assume businesses with high operating margins are, by definition, good businesses whereas those with low margins are not. This is common sense, right? Sorry to say it couldn’t be further from the truth.
We have here the following 4 companies from 2 industries: Air Lease and AerCap are both aircraft leasing companies. They purchase and lease commercial jet aircraft to airlines worldwide. The other two, probably better known, Walmart and Costco, are retail supermarkets.
While both leasing companies have extraordinary operating margins over 50%, our two supermarket retailers have margins below the 5%. Any inexperienced investor would state quickly that leasing companies are better businesses, but let’s take a closer look.
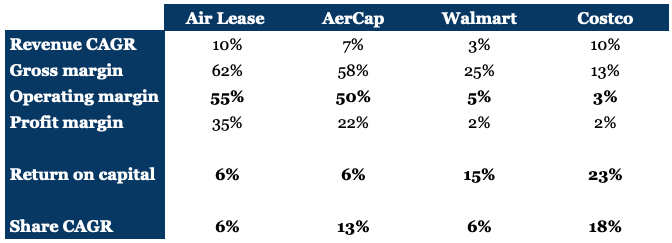
How is it possible that the worse business, in terms of operating margins, has been the best-performing business in terms of share price appreciation? The answer, as you can expect, is in the ROIC.
A clear sign of competitive advantage
Return on invested capital is calculated as follows:
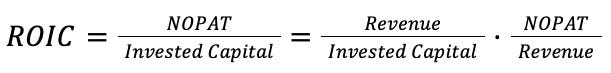
NOPAT is the net operating profit after taxes and can be calculated as EBITA-cash taxes (Mauboussin & Callahan, 2014). In the third part of the series, we will dive deep into examples and numbers. The important thing here is to understand the concepts clearly.
Note how the ROIC can be expressed in 2 terms:
- Revenue/Invested capital expresses the cost and capital efficiency: the capital a company needs to employ to get its revenue. This rate can be increased with innovative business models, having access to unique resources, or achieving scalable products or processes.
- NOPAT/Revenue expresses the operating excellence and price premium: similar to the operating margin, this is a well-common metric that takes into account the brand pricing power, quality, and innovation of products or the achievement of economies of scale.
In our previous examples, Air Lease and AerCap need to lock immense amounts of capital to buy the aircraft. Even if the operating expenses are little, the overall return on capital is low. On the other side, Costco outperforms Walmart despite having lower operating margins (or precisely because of it ). ROIC is a clear sign of particular competitive advantage, particularly when comparing within companies in the same industry. Competitive advantages are a wonderful topic to discuss about, but we will leave it for another future series of articles.
Calculating the invested capital
We have been talking about invested capital all the time, but what is it actually? Again, this is the complex part of the analysis because it is not trivial and requires to understand of accounting concepts and how the company operates. It can be calculated using both sides of the balance sheet, but my preference is clearly to use the asset side. In the end, the assets are the ones necessary to generate our income.
Easily stated, invested capital is:
Invested capital= Net property, plant and equipment + Goodwill+ Current assets + Other operating assets - Non-interest bearing current liabilities
In summary, the sum of all the assets the company needs to operate, minus the current liabilities that are not incurring in interests. If you are wondering about whether to include an item in invested capital, simply ask if the company could generate the same level of NOPAT without it. If not, include it. If so, exclude it.
We will see how to apply this concept to some companies in the 3rd part of this series, but for those who cannot wait, you can find a detailed explanation in Mauboussin’s (2014) articles for Credit Suisse in the references.
At the end of the day, as explained by Stannard-Stockton (2016), the most important thing is not how you define a formula but the degree to which it is useful in helping you make good decisions.
Growth
Another lever to intrinsic value creation will be growth. But one might think growth is pretty straightforward, right? We want always our company to grow, no matter what. In the same way, a high operating margin doesn’t make a company good, growth can also destroy intrinsic value.
To explain it, let me introduce another simple concept: the economic value added. It is defined by academics by EVA=Invested Capital*(ROIC-WACC). You already know I am not very fond of WACC as a concept, especially for us, investors. To make it easy, I would substitute the WACC for your own opportunity cost value.
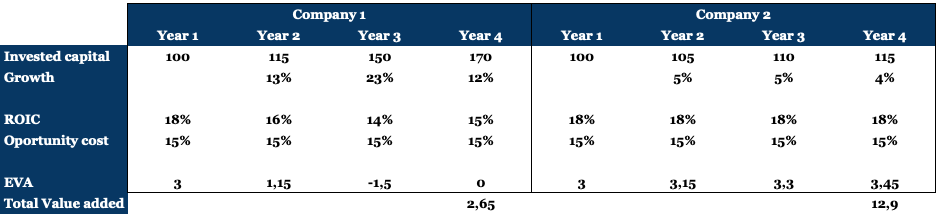
Consider in this case that an increase in the invested capital is automatically transferred into an equivalent increase in revenue. Company 1 has increased its revenues by well over 10% annually. However, company 2 has been more conservative and has only grown in the mid-single digits. If you ask anybody with this information, everybody will say company 1 has created more returns for the shareholders. But again, we would be wrong.
Growth only creates value when it is at returns on capital over our opportunity cost. Beware of management teams seeking growth by growth.
Not all growth is created equal
In the fantastic McKinsey’s Valuation book, Koller et al (2020) describe how different new sources of revenue typically create more or less value.
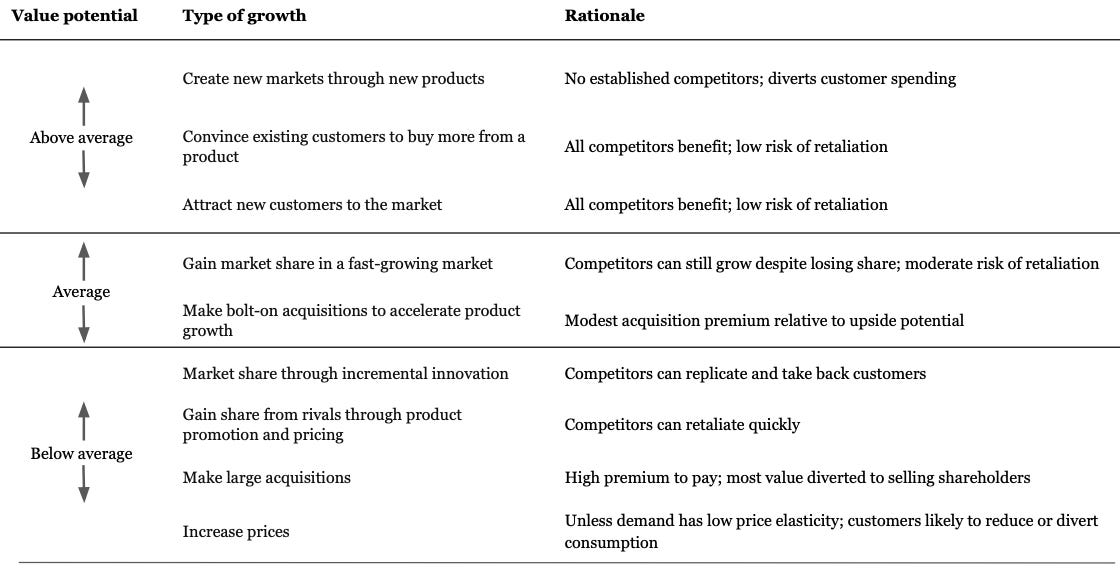
They claim that being in fast-growing markets is the largest driver of growth (and value creation). Market share growth is generally less important, yet managers tend to focus most of their attention on gaining a share in their existing product markets. While it's necessary to maintain and sometimes increase market share, changing a company's exposure to growing and shrinking market segments should be a major focus according to Koller et al (2020).
In the end, if we think about it, there are 3 different big areas on how to achieve new revenues:
Organic growth via CAPEX or R&D: investing in the company for growth. Costco opening new stores in new geographies, Meta investing massively in developing the metaverse, or Netflix buying the rights of the next TV show hit. These are risky, they require new capital, our capital, hence we must make sure we get the appropriate returns.
Inorganic growth with M&A: a company achieves growth when it buys or sells revenues through acquisitions or divestments. It is well known most acquisitions destroy value. Therefore we have to be vigilant.
Organic growth (without new capital): I have reserved the best for the end. These rare companies can achieve new revenues without investing anything. Those beautiful and scarce moats. These are the ones creating the most value. Imagine Apple gaining market share not because they are making price reductions, investing in marketing, or because of the new features of their last iPhone. Just because Apple is Apple. Another extraordinary case would be Microsoft Office's change of business model to a subscription one. What was the investment required? None or very limited. However, the impact on the growth rates has been remarkable.
This is all for today. In the next post, we will focus on the ROIIC and the reinvestment rate, two concepts that will complement our view on how to spot companies creating value.
If you enjoyed this piece, please give it a like and share!
Thanks for reading Edelweiss Capital Research! Subscribe for free to receive new posts and support our work.
If you want to stay in touch with more frequent economic/investing-related content, give us a follow on Twitter @Edelweiss_Cap. We are happy to receive suggestions on how we can improve our work.
References & bibliography
Ahern, D. (2021) Investor’s Guide to Incremental Invested Capital (ROIIC). EIB. https://einvestingforbeginners.com/incremental-invested-capital-roiic-daah/
Bezos, J. (2004). Letter to shareholders. Amazon.com https://www.sec.gov/Archives/edgar/data/1018724/000119312505070440/dex991.htm
Huber, J. (2016a). Calculating the Return on Incremental Capital Investments. Saber Capital Management. https://sabercapitalmgt.com/calculating-the-return-on-incremental-capital-investments/
Huber, J. (2016b). Importance of ROIC: “Reinvestment” vs “Legacy” Moats. Saber Capital Management.https://sabercapitalmgt.com/importance-of-roic-reinvestment-vs-legacy-moats/
Koller, T., Goedhart, M., Wessels, D. (2020) Valuation: Measuring and Managing the Value of Companies. Wiley. 7th edition
Mauboussin, M.J., Callahan, D. (2014) Calculating Return on Invested Capital: How to Determine ROIC and Address Common Issues. Credit Suisse.
Leonard, M. (2010). Letter to shareholders 2009. Constellation Software.
Lui. F (2017). Calculating Incremental ROICs. Hayden Capital. https://www.haydencapital.com/wp-content/uploads/COBF_Incremental-ROIC.pdf
Stannard-Stockton, S. (2016) Return on invested capital: why it matters & how we calculate it. Ensemble Capital. https://intrinsicinvesting.com/2016/04/12/return-on-invested-capital-why-it-matters-how-we-calculate-it/
Hi Edu, thanks for your kind words.
Totally, as you know, ROIC is not a one time parameter. I tend to use half the invested period of the previous year and half of the current year. Eventually, it is a tool to see how profitable a company is with the capital and what the trend ;)
A really enjoyable discussion