

#26 Compounding value: Part III
#26 Compounding value: Part III
The holy grail of long-term investing: a case study with Louis Vuitton Moët Hennessy

In the last two post we have explore the intrinsics of operational intrinsic value creation. Today, we are going to apply them diving deep into Louis Vuitton Moët Hennessy (LVMH) financial statements. In the 5 years between 2016 and 2021, LVMH share price has compounded at a 27 CAGR. Was it deserved?
Welcome to Edelweiss Capital Research! If you are new here, join us to receive investment analyses, economic pills, and investing frameworks by subscribing below:
Intro Louis Vuitton
The white French stallion has ridden freely in recent years to new highs. The 135-year-old company, headed in recent times by Bernard Arnault, is living its umpteenth youth.
With the new rider at command, the company began in 1988 a revolution that has made it one of the most recognized companies and brands in the world. Dom Pérignon, Christian Dios, Moët & Chandon, the eternal Tiffany's, the ever elegant LV bags, and a large host of other brands hang all under the umbrella of Mr. Arnault.
He implemented a decentralised operating system and gave birth to an ambitious M&A program which culminated with the acquisition of Tiffany & Co. at the end of 2020 for $16 billion. The shares compounded during the last 20 years at 15% CAGR. However, during the 5 year period between 2016 and 2021, the share price compounded at more than 27% CAGR. Let’s try to discover if the company fundamentals justified this extraordinary performance in the markets.
First things first
In many other publications, people leave the financial statements for the end as an appendix. I prefer to put them at the very beginning, even at a risk that you stop reading just now.
In the same way that we cannot prepare a good pizza without letting the dough rest for many hours, we, investors, need to knead and treat our dough well, and this is the financial statements. They give us the best quality information we can get, although they can also be a management trick to make us believe that a company is better than it is.
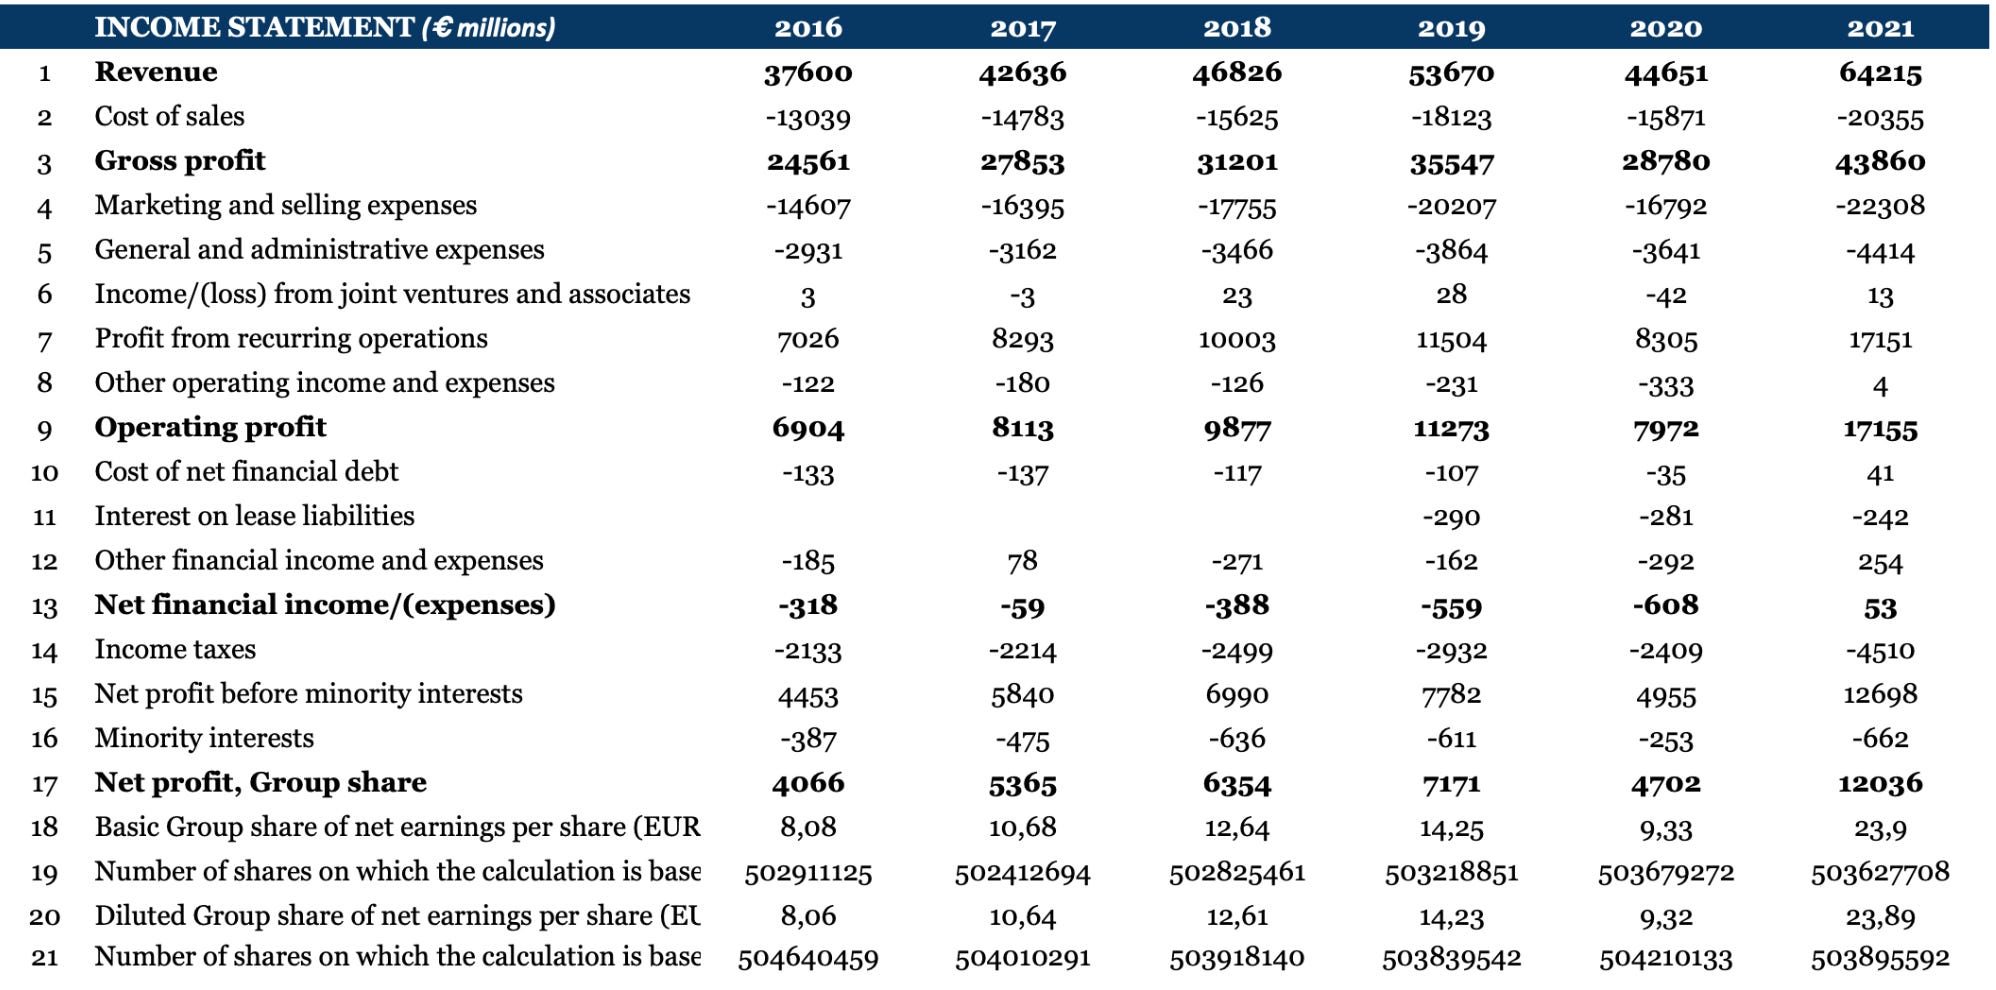
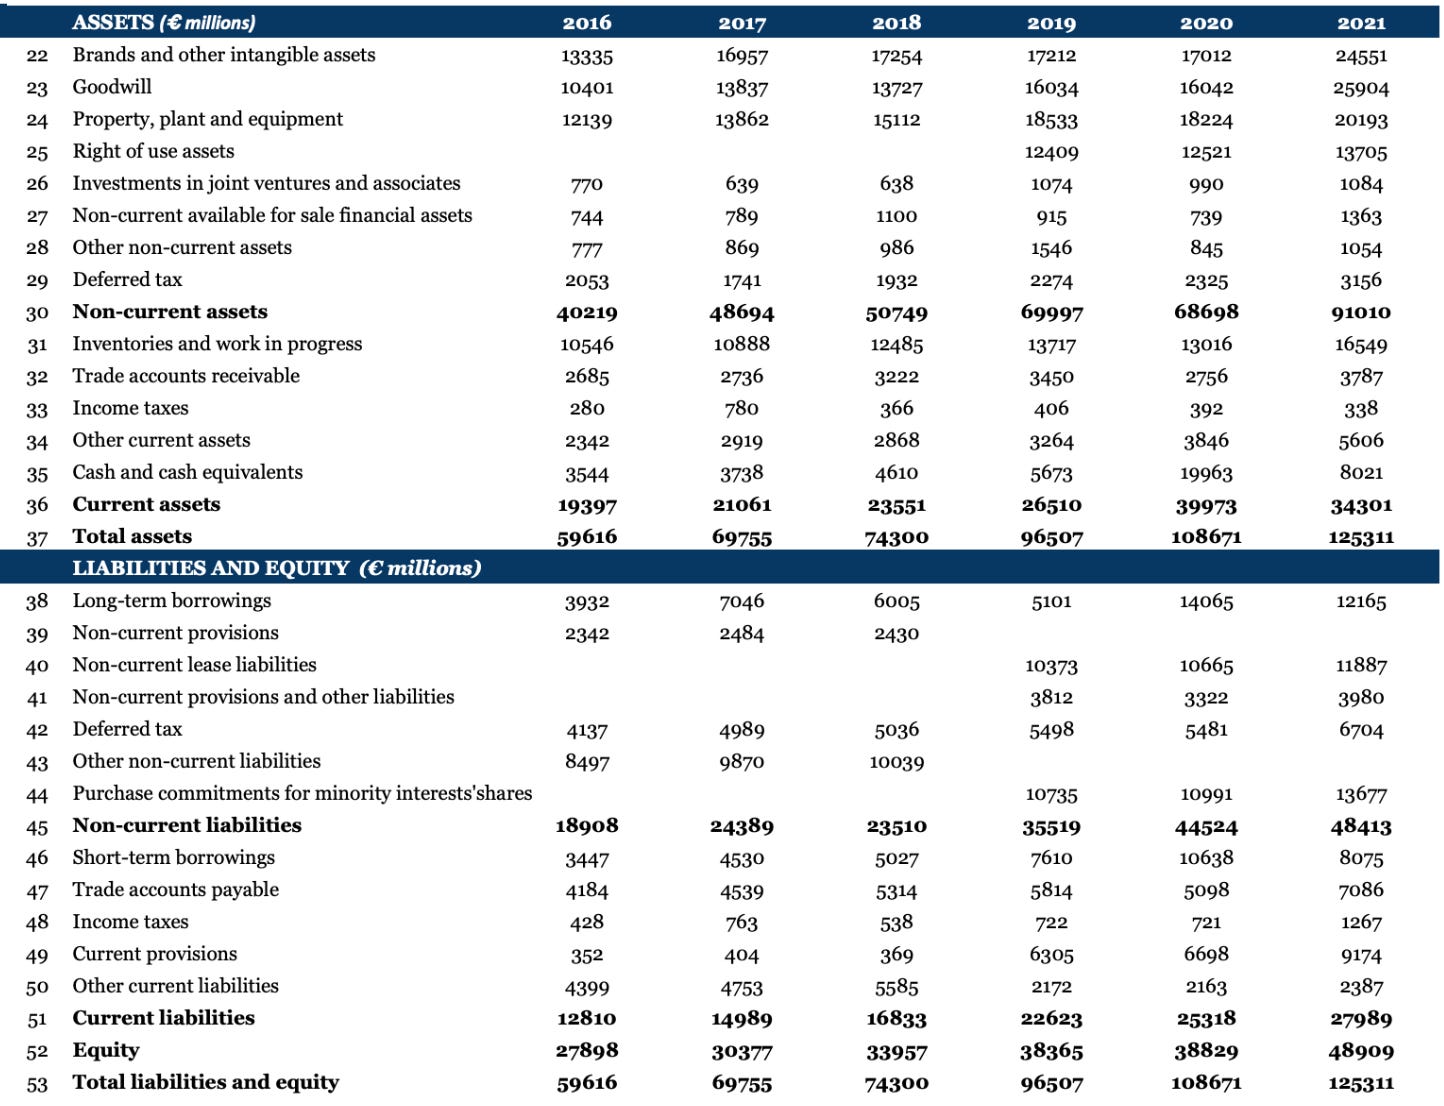
So here they are, the income statement and the balance sheet of LVMH during the period between 2016 and 2021. Note there is a number before each line entry which help us later to understand what we do. I am not attaching the cash flows statement. Eventually we could derive it from these two, and it is a basic piece for any analysis, but it is out of the scope today.
Quality and returns on capital
A clear sign of a company’s quality is its return on capital invested. Capitalism is fierce. If a company achieve constantly returns on capital well above its cost of capital, we found a special castle with a wide moat around it. We might not know what it is, but there is something.
As we mention in the previous articles, to reach the return on capital invested for a company we have to play a bit around with the numbers and we have to understand what we are doing. That’s the reason why so many people, including most managements, focus only in revenue growth and operating/profit margin. It is simpler, but it is only half of the story.
The numerator of ROIC is net operating profit after tax (NOPAT), which measures the cash earnings of a company before financing costs. Below how we got there from the financial statements:
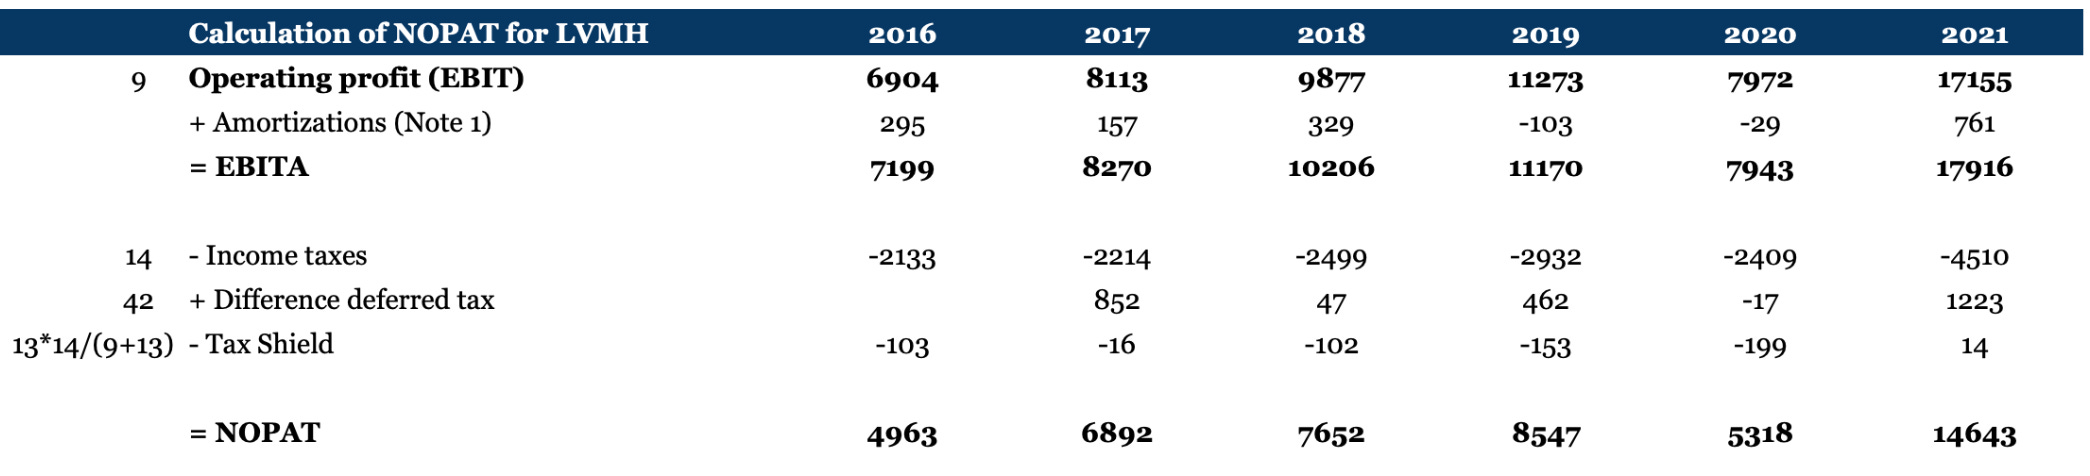
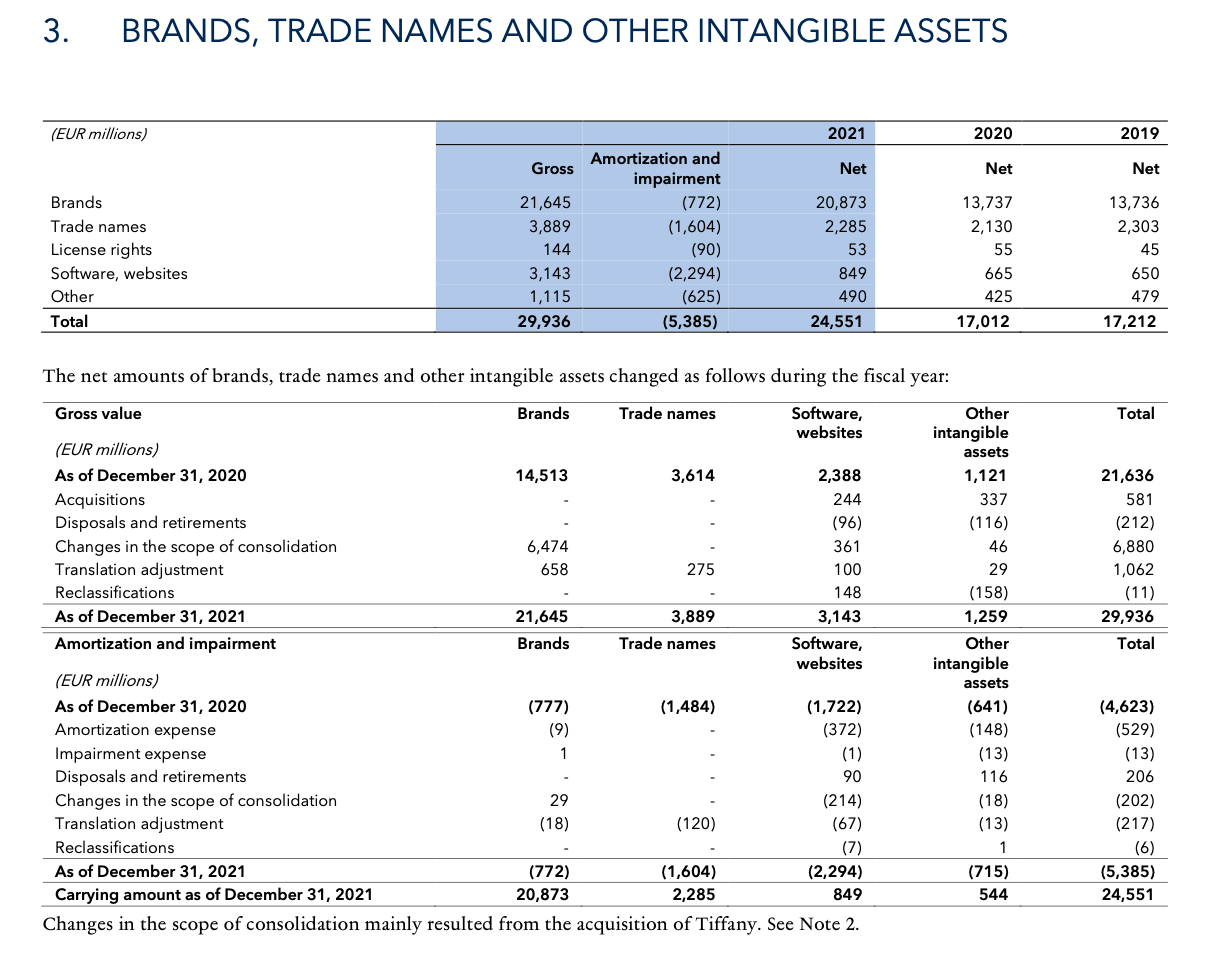
Note 1: Adding back amortizations is essential since we will add them back also to the invested capital together with the goodwill and impaired goodwill. Non tangible assets might not be physical, but the company has invested capital in those ones and we should consider them in our calculation for invested capital and hence, we should add them back to our NOPAT (even if in the case of LVMH it doesn’t impact that much).
To get it done properly, we must dig in each of the annual reports for the years we want to analyze and look for the notes dealing with the amortization of intangible assets. This is how it looks for LVMH in the year 2021:
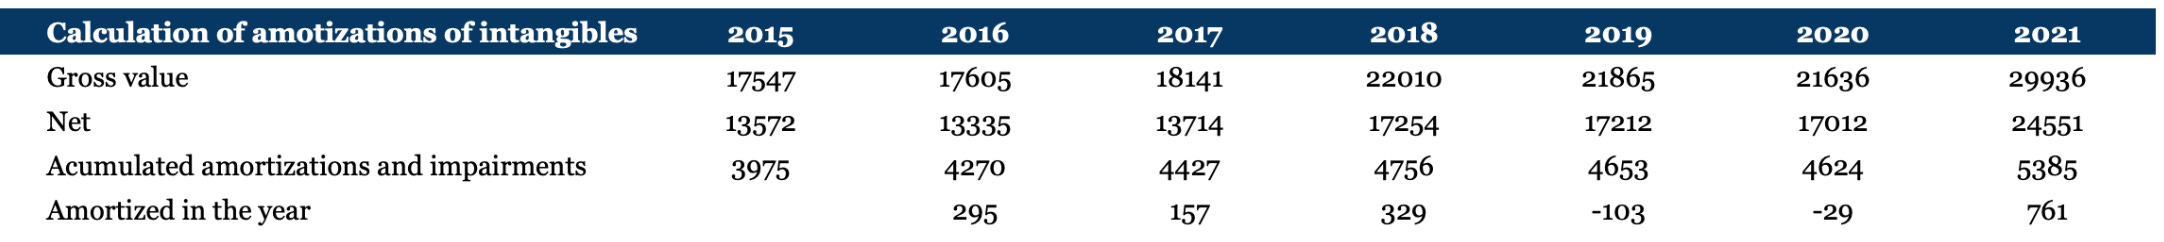
And this is a table with the basic data for all those years we need:
Let’s get back to NOPAT. As we can see, NOPAT assumes no financial leverage. NOPAT is the same whether a company is highly levered or free of debt. This is essential for comparability. Afterwards we can decide a company is highly leveraged and it is too risky. But this is another analysis.
We move now to the calculation of the invested capital. The idea is quite simple. Sum all the non current operating assets plus the net working capital. But there are some little tweaks we discuss further in the notes below:
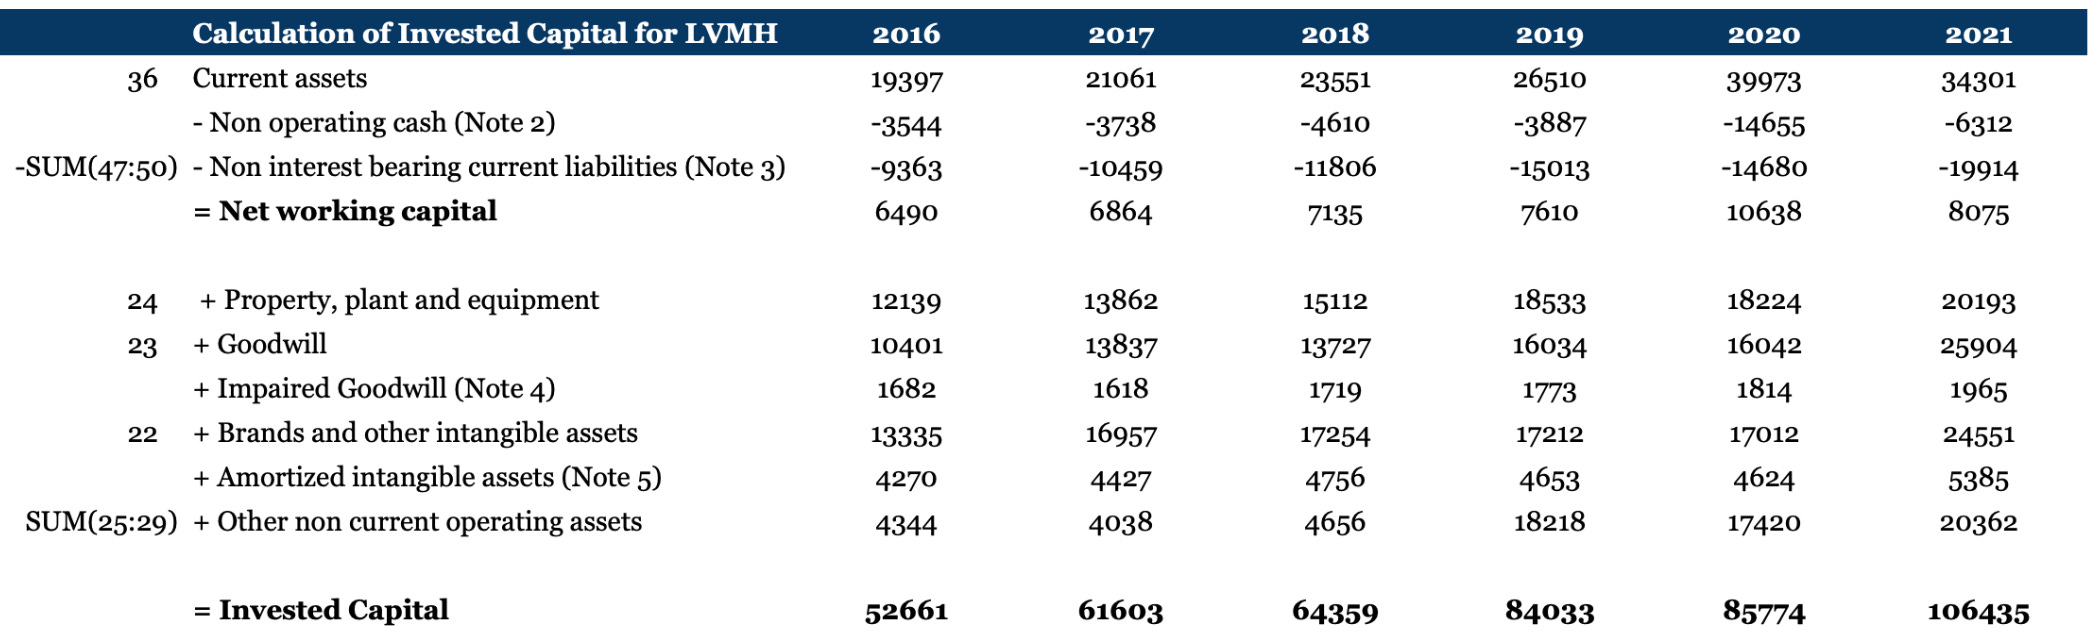
Note 2: I believe an investor should consider the ROIC calculation and capital allocation decisions differently. The goal of an ROIC calculation is to understand how efficiently a company uses its operating capital. The capital allocation assessment should focus on the likely ways a company will deploy its capital and what the prospective returns may look like (Mauboussin & Callahan, 2014). Therefore, we must only include in the invested capital the amount of cash a company needs to run its business. This will depend on the business, the cash conversion cycle, etc.
LVMH doesn't hold huge amounts of cash and it is not that relevant for our calculation, so in this case I considered simply as non-operating cash the excess of cash necessary to cover the payment of the current liabilities with the current assets.
Note 3: We deduct the non interest bearing liabilities, as they normally are the result of the business model or the bargain power of the company with its suppliers or customers.
Note 4: Goodwill comes from the excess in price a company paid for an acquisition over the book value. Therefore, goodwill is an accounting note to reflect some previos capital invested in acquisitions. I never understand how some investors deduct it for the calculation of the returns on capital. To be completely fair, the proper and ideal way to face this would be to split the returns on capital from the original operating business, and then analyze independently the returns on the acquisitions. But for that we would need to live in a fairy tale and companies would be disclosing this information. But guess what, they never do it because it would show how the management normally overpays for acquisitions.
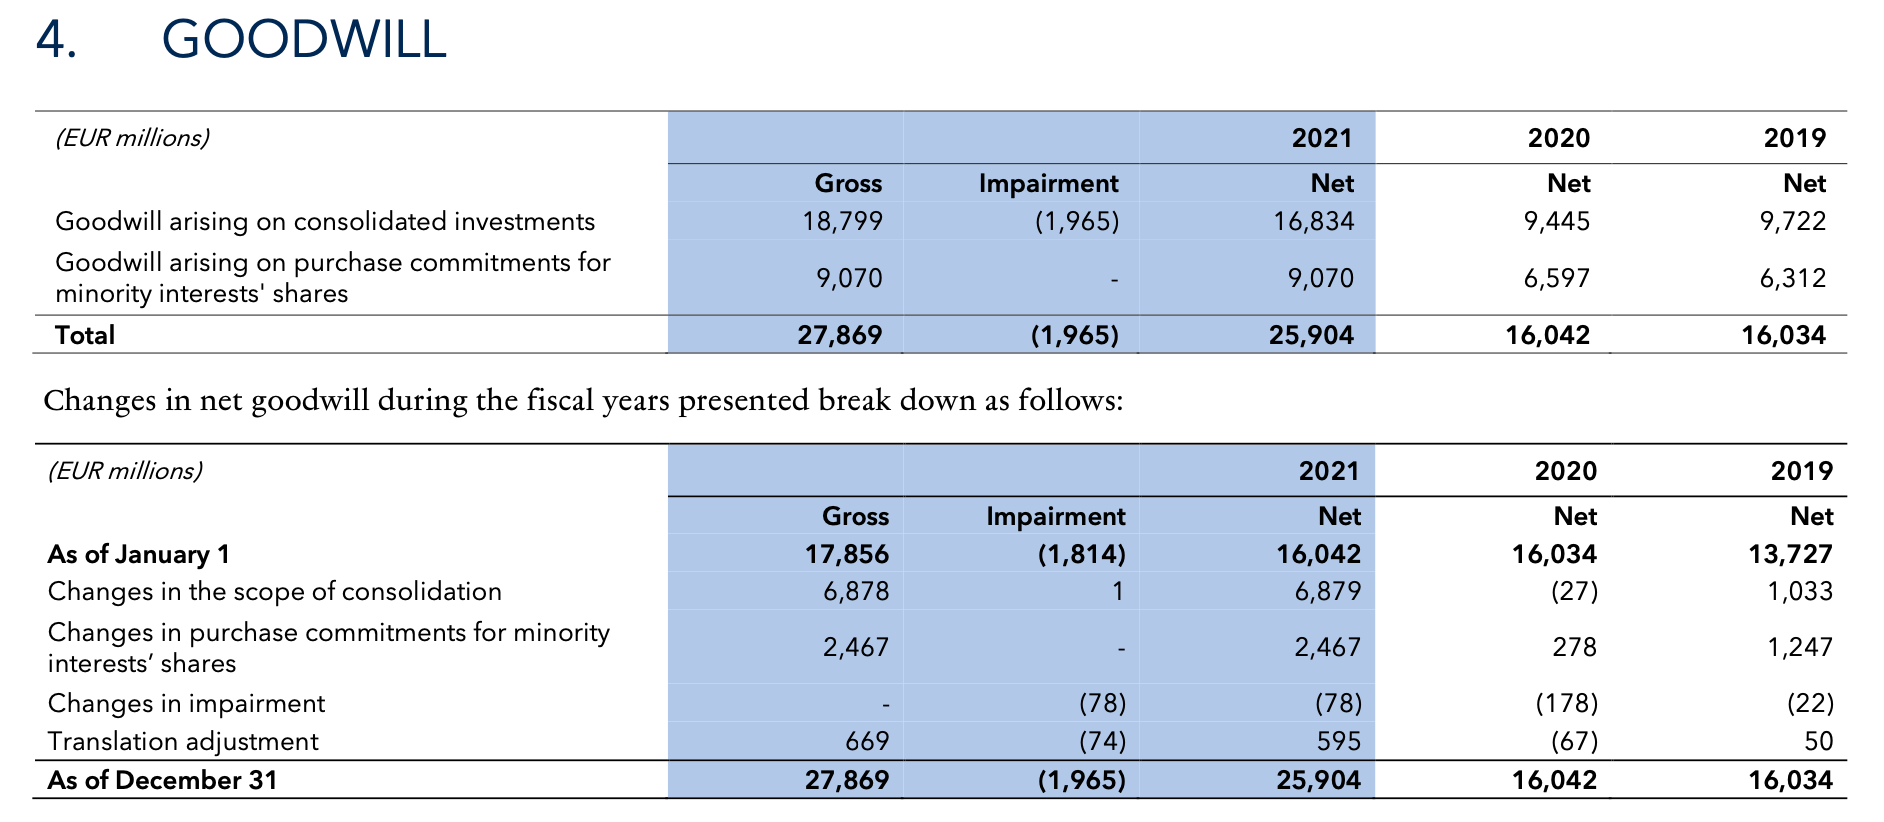
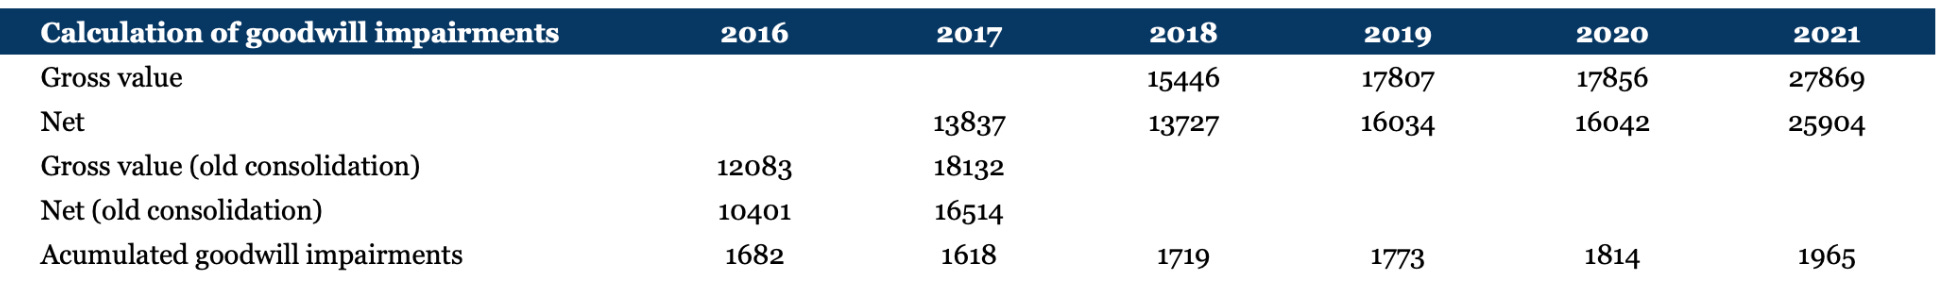
Companies write-down or impair the goodwill if they see some deterioration in the carrying value of the assets they bought. But even if they do so, the capital outflow existed and it is not erased, so we have to add it back for our fair calculation. Similarly to the amortization, we have to dig in the previous annual reports to get the current amounts for each year:
Note 5: For the calculation of NOPAT we add back the amortized quantity during the year. For the invested capital of every year, we need to add back the cumulative amortized intangibles, in the same way and under the same rationale we did for the goodwill.
Putting it all together
Now we have reconciled all the operating metrics we needed. Making use of what we have seen during the last two articles, we can come up with a table like this one:
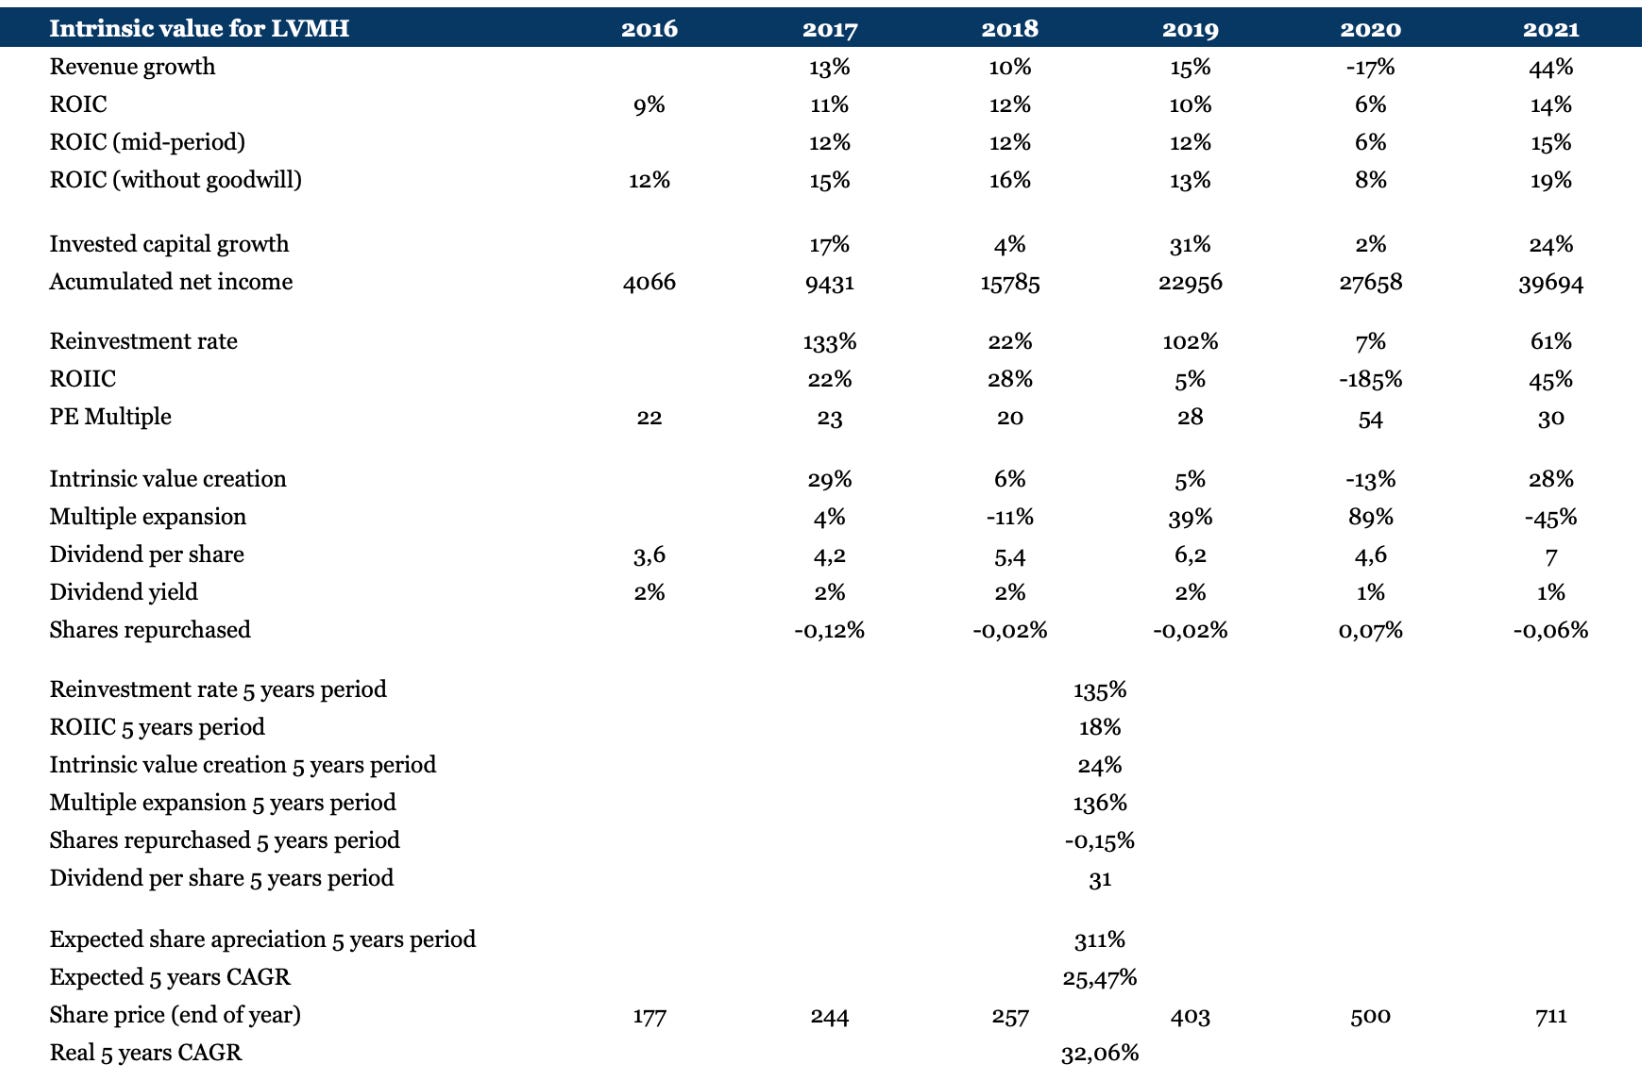
The formula I used to derive my 5 years expected CAGR is:
CAGR 5 years=(1+5y Reinvestment rate * 5y ROIIC) * (1+5y Multiple expansion) * (1-5y % Shares repurchased) + (5y Accumulated dividends / Initial share price)
As you can see, there is an extra 7% CAGR that can not be explained. Three potential explanations for this discrepancy. 1) There is a mistake in the numbers. I hope not. 2) In the end, I took a particular share price for the end of each operating year and it could incur into some deviations. 3) It could be that the share price was a bit undervalued in 2016 or quite overvalued at the end of 2021 (my bet).
Again, numbers rarely lie, and LVMH fundamentals compounded at incredible rates during these 5 years. However, beware that most of this appreciation comes from the multiple expansion, and it can be treacherous and backfire at some point. LVMH returns on capital are good but not espectacular as we could have expected. Most probably, the business itself has a higher return, but the prices paid for the acquisitions are dragging the returns.
If you enjoyed this piece, please give it a like and share!
Thanks for reading Edelweiss Capital Research! Subscribe for free to receive new posts and support our work.
If you want to stay in touch with more frequent economic/investing-related content, give us a follow on Twitter @Edelweiss_Cap. We are happy to receive suggestions on how we can improve our work.
References
Ahern, D. (2021) Investor’s Guide to Incremental Invested Capital (ROIIC). EIB. Link
Bezos, J. (2004). Letter to shareholders. Amazon.com Link
Huber, J. (2016a). Calculating the Return on Incremental Capital Investments. Saber Capital Management. Link
Huber, J. (2016b). Importance of ROIC: “Reinvestment” vs “Legacy” Moats. Saber Capital Management.Link
Koller, T., Goedhart, M., Wessels, D.(2020) Valuation: Measuring and Managing the Value of Companies. Wiley. 7th edition
Mauboussin, M.J., Callahan, D. (2014) Calculating Return on Invested Capital: How to Determine ROIC and Address Common Issues. Credit Suisse. Link
Leonard, M. (2010). Letter to shareholders 2009. Constellation Software.
Lui. F (2017). Calculating Incremental ROIC’s. Hayden Capital. Link
LVMH Louis Vuitton Moët Hennessy. Consolidated Financial Statements. Link
Stannard-Stockton, S. (2016) Return on invested capital: why it matters & how we calculate it. Ensemble Capital. Link
Very nice piece.
And I agree - I've never quite understood why some people exclude goodwill when calculating invested capital. It was certainly paid for, it was a real cost! However, I do understand isolating to calc things such as return on net tangible assets. That helps provide context into understanding the physical demands of the company as it grows and matures and helps illustrate what kind of operating leverage can be achieved from G&I.
Can you kindly explain how you derived (as well as the rational) the CAGR 5 years=(1+5y Reinvestment rate * 5y ROIIC) * (1+5y Multiple expansion) * (1-5y % Shares repurchased) + (5y Accumulated dividends / Initial share price)?